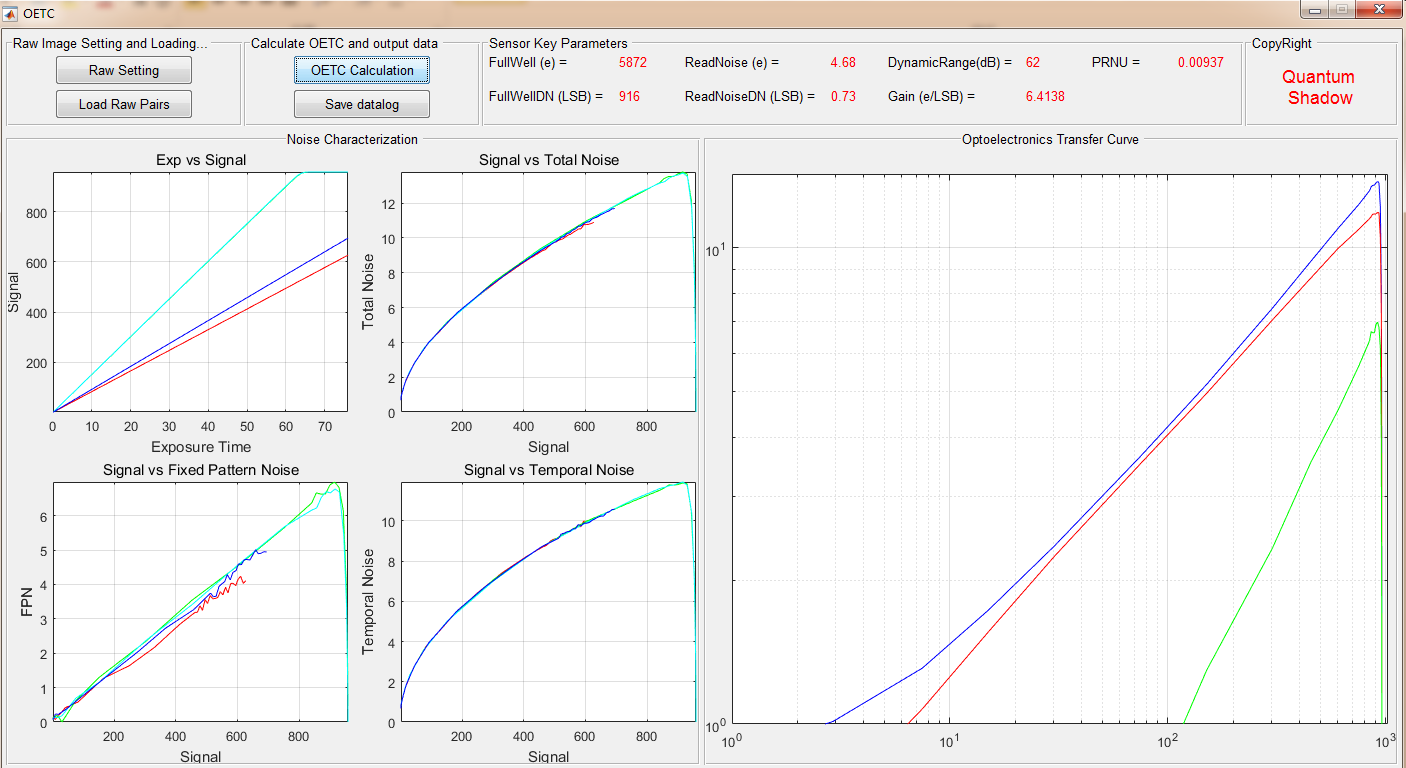
11.OETC
光电转换曲线性能测试
各噪声成分特性分析
满阱电子数FWC测试
读出噪声电子数测试
极限饱和动态范围测试
光电响应非一致性PRNU测试
An Optoelectronics transfer curve can be used to show many important features of a camera’s response to illumination, in particular the gain and the full-well limit. An Optoelectronics transfer curve is obtained by taking a series of pairs of uniformly illuminated exposures. Each pair of light frames is made for the same exposure time, but the exposure time is varied from pair to pair. The signal level and noise are determined for each pair of exposures and the noise is plotted against the signal on logarithmic axes.
光电转换曲线
OETC uses the well-known law of Poisson distribution to realize the calculation from digital signal to analogue signal, according to that, full-well capacity and read noise can be calculated in unit of “e”, as well as most accurate dynamic range in common defined way is calculated, PRNU(photon response non uniformity) is also able to be calculated.
Those parameters are most basic but most important to test a camera sensor(CMOS/CCD) performance, those are somehow like lens MTF/RI parameters. Therefore, this test is very helpful and basically mandatory to validate a sensor performance, especially it is a classic methodology to check sensor from design phase, sample validation phase and production sampling test.
To start OETC test, set the raw information first correctly, then load the raw image pairs by clicking the related button, after the SW showing the successful message, you can click the “OETC Calculation” button, then all sensor important key parameters or characterization noise profiles are shown in the figure as above. Please noted that the capture condition and saved raw files naming as mentioned at previous sections.
The output include signal vs exposure plot, signal vs total noise plot, signal vs FPN plot, signal vs temporal noise plot and OETC curve plot.
Also, at the top of the figure UI, the most important parameters of sensor property are calculated, including Fullwell capacity, read noise, dynamic range, PRNU.
Finally, you can also save the datas to a log file in csv format for further analysis.
This test result is highly dependent on the sensor design, process and product quality, there is no need to specify a fixed spec for a sensor, because the result is more for benchmark or test the actual sensor if it meets what the sensor vendor claimed.
In general, FW / DR is higher, sensor is better, read noise / PRNU is smaller, sensor is better.
Also, you can evaluate the sensor properties by check the noise profiles.
However, we give a recommended requirement for reference:
For worst case, DR>=xxdB, PRNU<0.0x (x%)
For high-end camera(flagship camera phone), DR>=6xdB, PRNU<0.00x(even better).